 GMA
The US supplement market, seen through the household budget.
Current use, regular use and a hypothetical price rise answer different questions. The CRN 2026 survey helps put affordability in its proper market context.
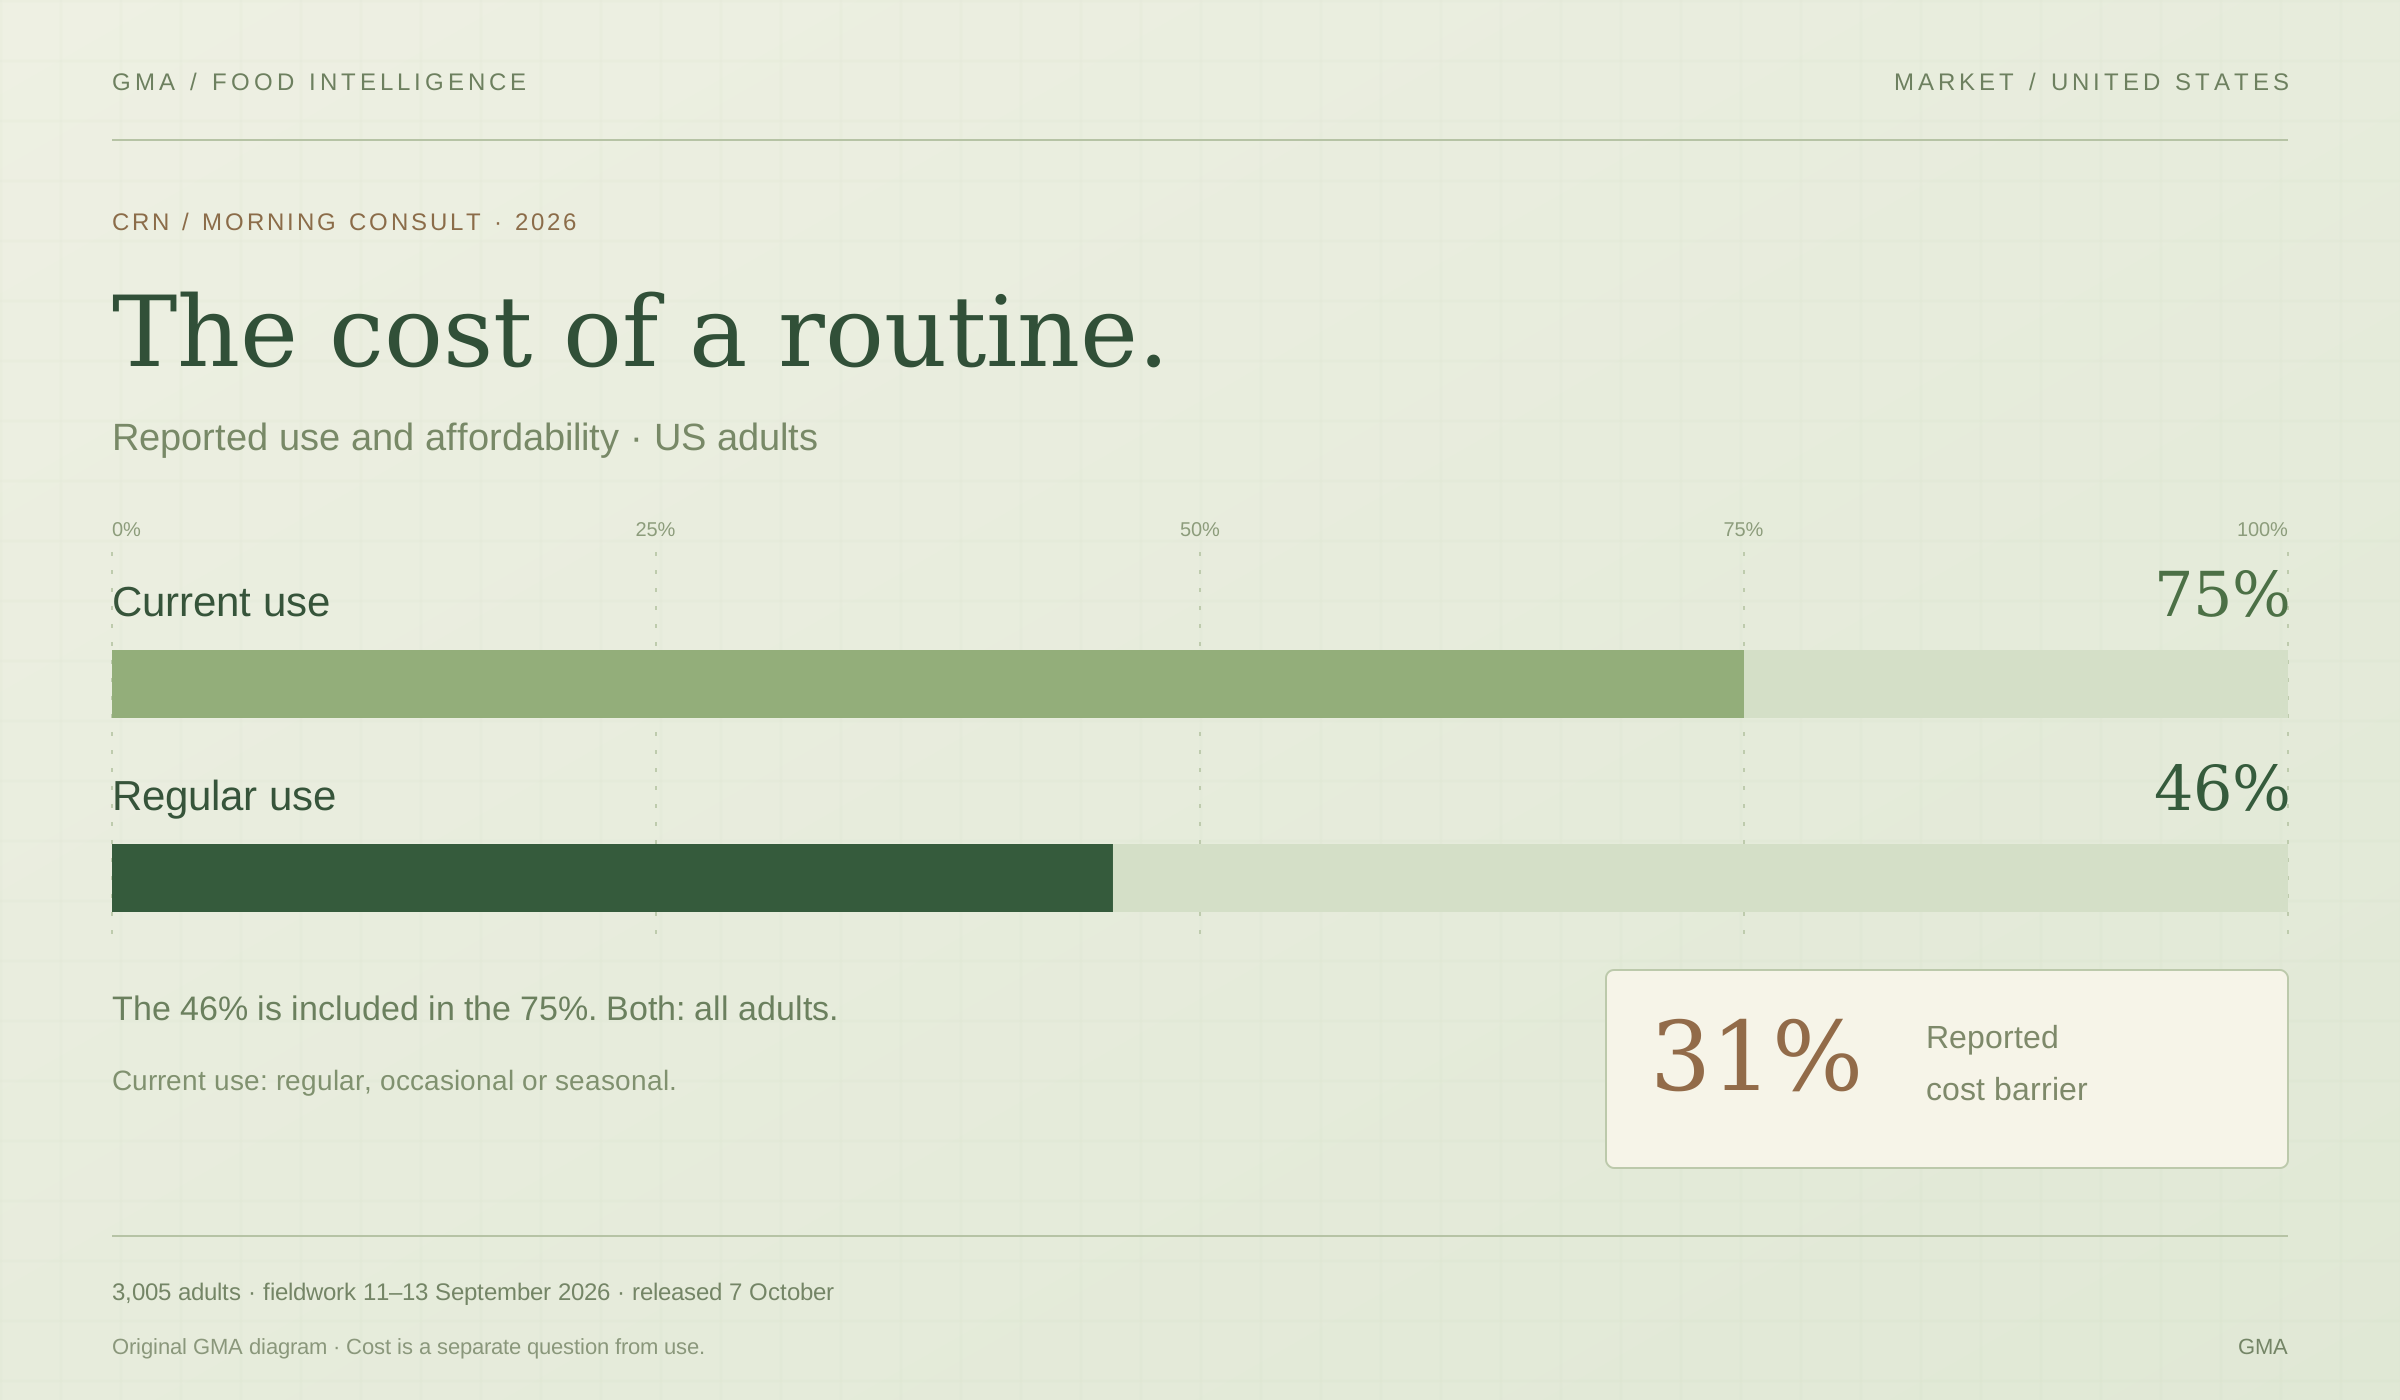
Three in four US adults report using dietary supplements. Fewer than half report regular use. The distance between those measures opens a question about the place a product occupies in everyday life — and the budget needed to keep it there.
The Council for Responsible Nutrition’s 2026 survey puts numbers beside that question: 31% of adults say cost has discouraged supplement use or made regular use harder. That is a reported obstacle within a widely used category. Understanding its commercial meaning requires a close look at who answered and what they were asked.
A large audience contains different routines.
CRN released the findings on 7 October. Morning Consult conducted the online poll among 3,005 US adults aged 18 and older on 11–13 September 2026, with weighting to approximate the adult population. It is a survey of reported behaviour and attitudes, rather than a panel of retail transactions.
The 75% reporting current use includes seasonal, occasional and regular use. The 46% reporting regular use includes people who regularly take only a multivitamin. Both percentages refer to all US adults: 46% is not the proportion of current users who use supplements regularly.
That distinction matters when a brand defines its audience. A seasonal purchase and an established routine can imply different pack sizes, replenishment cycles and expectations. The survey does not identify those purchasing patterns for a particular product. Nor can the difference between the two percentages be labelled lost adherence or customer attrition: the poll is a snapshot, and occasional use may be intentional.
Three perspectives on the same market.
Choose a perspective and keep the question beside the result. Percentages reported by CRN; scale from 0 to 100%.
Regular use is included in current use.
Both percentages refer to all adults, not two groups to add together. Seasonal and occasional use are included in the 75%.
A reported cost barrier and a stated response are different measures.
Cost discouraged use or made regular use harder. Base: all US adults.
Hypothetical responses, not observed sales. The 73% combines different behaviours; these two groups do not exhaust the survey’s responses.
Important for health: the population matters.
The 65% concerns people who already use supplements. It does not measure growth from 52%, and the full-sample margin does not automatically describe the subgroup.
What the price question can tell a business.
Cost was the most commonly cited barrier in CRN’s public release. The 31% figure combines adults who say supplements being too expensive discouraged use with those who say it made regular use more difficult. It does not separate a decision never to buy from a decision to buy less often, and it is not a share of supplement users alone.
A different question introduced an approximately 15% rise in the price of supplements people currently buy or might consider buying. In that hypothetical situation, 73% of all adults said their first response would be to seek savings, reduce purchases or forgo buying; 9% would pay more without another change. These are selected response groups disclosed by CRN, rather than a complete breakdown of every answer.
The result gives a reason to investigate how consumers adjust. It does not quantify a future sales decline. Seeking a discount, switching an offer and abandoning a purchase have different commercial consequences, but the published 73% groups them together. No volume response is measured, so the figure cannot provide a price elasticity or a revenue forecast.

The product is only one part of the routine.
Format, recommended servings and replenishment determine what the shelf price means in use. The findings frame a product-level test, with its actual serving size and replenishment cycle.
The value question is wider than the ticket price.
The same source reports that 52% of all adults regard supplements as essential or important to maintaining health and wellness. Among current users, that figure is 65%. The denominator has changed. The second number describes a selected group; it is neither an increase over time nor a more precise version of the first.
The survey also finds that 81% of adults consider scientific evidence very or somewhat important when deciding whether a supplement is right for them. Independent quality verification would increase confidence for 77%. These answers concern information and confidence. They do not establish clinical efficacy, demonstrate product quality or reveal what premium a buyer would pay.
For product development, this suggests a practical question to test: can a consumer understand what a routine costs and what the product supplies? A pack price alone does not show cost per recommended serving or how long the pack will last. Reducing the amount delivered can lower the apparent price while changing the formulation being offered. A meaningful comparison needs the intended regimen and the evidence that supports it.
What a manufacturer can test next.
The next useful evidence comes from a defined product and audience. A business could compare actual first and repeat purchases across clearly described pack sizes, price points and replenishment options. That would help distinguish a search for a better offer from a decision to stop using the product. Those are proposed research questions, rather than outcomes established by this poll.
The scope of the source also matters. CRN is a US trade association representing supplement and functional food businesses, and it commissioned the survey. Its release also promotes the association’s position on federal product listing. The full dataset and demographic detail are available to its members; this analysis uses the public findings. Those findings do not show how the reported cost barrier varies by category, income or frequency of use.
For ingredient suppliers and brands, the survey is therefore a starting point for more specific commercial work. A large reported user base does not describe the repeat-purchase prospects of a particular formula. To understand whether that formula earns a place in a regular routine, the next step is to examine its total cost alongside observed purchasing behaviour.
Keep the question attached to the number.
Every percentage below retains its population and question. CRN reports a full-sample margin of error of ±1.8 percentage points. That figure should not be applied automatically to the current-user subgroup. Percentages are rounded.
- Fieldwork
- 11–13 September 2026
- Sample and collection
- 3,005 US adults · aged 18+ · online
- Research and commissioner
- Morning Consult / CRN
- Weighting
- To approximate the US adult population
- Reported margin
- ±1.8 percentage points · full sample
- Source release
- 7 October 2026
Data table, populations and download
| Measure | % | Population | Response type |
|---|---|---|---|
| Current supplement use | 75 | All US adults | Reported use |
| Regular supplement use | 46 | All US adults | Reported use; included in current use |
| Cost discouraged use or made regular use harder | 31 | All US adults | Reported barrier |
| Seek savings, reduce purchases or forgo buying | 73 | All US adults | First stated response to a hypothetical ~15% price rise |
| Pay more without other changes | 9 | All US adults | First stated response to a hypothetical ~15% price rise |
| Supplements essential or important for health | 52 | All US adults | Reported importance |
| Supplements essential or important for health | 65 | Current supplement users; subgroup size not disclosed in public summary | Reported importance; different denominator |
| Scientific evidence very or somewhat important | 81 | All US adults | Importance when deciding if a supplement is right for them |
| Independent quality verification would increase confidence | 77 | All US adults | Stated effect on confidence |
GMA transcription of public findings, not the respondent-level survey dataset. These values are not used to derive revenue, elasticity or a time trend.
Editorial analysis for industry professionals. Survey findings concern opinions and reported behaviour in the United States; they do not measure sales, product efficacy or safety. GMA editorial method.